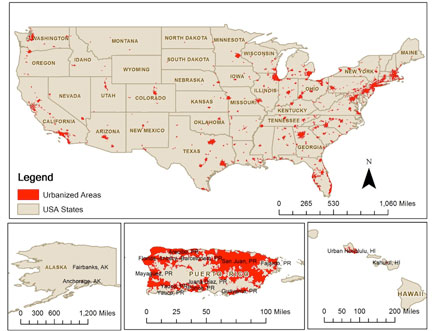
A new data system is available from the Global Transit Innovations (GTI) program.
The National Transit Map – United States describes the availability and performance of transit services in each of the 497 U.S. Census-defined urbanized areas (UZAs) using 2013 data from the U.S. National Transit Database (NTD). Three types of transit availability and performance indicators are included:
- Presence of various transit modes in each UZA
- Level of transit facilities in each UZA (both in total and by mode), including number of transit vehicles operated at maximum service, number of transit stations, and transitway mileage
- Annual performance of transit services in each UZA (both in total and by mode), including annual fare revenue earned, annual vehicle revenue miles, and annual unlinked passenger trips
The map makes NTD data more accessible to researcher communities and the public. People interested in knowing mode-specific transit service availability and performance can explore the map in various ways to examine geographic patterns.
“Spatial visualization of transit service measures helps people understand geographic disparities in transit services across the country,” says Yingling Fan, GTI director and the developer of the map.
For example, users can see the positive relationship between UZA population size and the presence of rail transit services—and the cities that are exceptions to this general rule. Tampa and Salt Lake City are two extreme cases: Tampa has a large population size yet relatively small percentage of rail services; Salt Lake City has a moderate population size yet relatively large percentage of rail services. “This type of data and visualization may stimulate interest in identifying underlying factors at the UZA level that influence transit service availability and performance,” Fan says.
To create the map, Fan developed a methodology to aggregate agency-level service data to the UZA level. “This project developed procedures to avoid double counting and deliver information at the UZA level, which is more useful for many urban-planning-related analyses,” Fan says. The compiled data were further visualized by a team of GIS professionals from U-Spatial, a collaborative consortium at the U of M.
In the next phase of her work, Fan is applying the methodology to develop a national transit map for China.
The U.S. map, compiled dataset, and methodology report are posted on the GTI website.


